.jpg)
Read more
HVAC Optimization
Tagup Selected as Approved Contractor for Con Edison Real-Time Energy Management Pilot Program
Learn More


Editor's Note: Since this publication, Beacon's HVAC optimization technology has been integrated into Tagup's Manifest platform. All capabilities previously known as Beacon are now known as Manifest.
Recently, I attended the AEE World conference in Orlando as part of our Tagup expo team. Our goal was to learn about the latest developments in energy sustainability and to present our AI HVAC optimization product, Beacon.
We had many interesting conversations at our booth. Several of them were specifically about how we assess the benefits that our product provides—in other words—measurement and verification, or M&V. Since this is an important and complex topic that is considered to require a certain expertise, there was even an add-on sticker for the conference name tag to advertise yourself as someone knowledgeable.
Clearly, this goes to the core of the product that we have built: Accurately assessing how much electricity, water, fuel, and money a customer can save when they sign up for our automated optimization service. That means not just naming a percentage value, pointing to a few case studies, or quoting a single ROI number. Rather, given the unique construction, location, and use pattern of any building, how do we quantify what exactly are the savings that our AI-driven software product can generate, hour-by-hour?
M&V for HVAC optimization hinges on comparing the impact of different control scenarios: in particular, how expenses and usage of consumables differ under one operation strategy compared to another. The first non-trivial point is that one of the strategies to compare against should be the one that has actually been used at the site prior to a new optimization deployment. For example, it is easy to claim that a product provides 30% savings over a scenario where condenser or chiller setpoints are kept fixed, but it is also not a helpful comparison if the site already employs fixed approach or seasonal setpoint changes.
Furthermore, it is important to outline the M&V strategy before changing anything, so that there is a clear and unbiased procedure established that is used to measure the impact of an optimization. Often, a direct comparison sounds desirable, i.e. operating in the newly optimized way only part of the time and switching back to the comparison scenario regularly. While seemingly straightforward, this approach actually has many disadvantages.
First, for cooling operations with large seasonal fluctuations in operating cost, only a test period of a full year could truly cover the full set of operating conditions for the desired comparison. But even if reduced to a number of months, it is worth considering how much this can delay the benefits from implementing a better control scenario. Switching back and forth between strategies would also need to be randomized on timescales of a day or less, in order to avoid, for example, that during the hottest week of the control period only data from one scenario is available. And not only weather but also building usage patterns across different days or weeks can impact the comparison at the end. While it is certainly possible to devise normalization procedures to factor out such influences after the data is taken, it should be pointed out that this is then in direct contradiction of the desire to do an “on/off” comparison on grounds of the simplicity and clarity of that approach.
Our closed-loop control optimization product, Beacon, is built around a machine learning model that is being continuously trained on data from the building at which the optimization is deployed. Using sensors that are generally in place already and an integration on top of the existing building management system (BMS), the cloud-hosted software has access to all relevant information, from temperatures and flow rates in the system to actual heating or cooling loads and outside air conditions.
With this information, the machine learning model can accurately predict the amount of electricity and water, and therefore utility cost, that would be incurred under any allowed control choices, for example any condenser setpoint value(1). This computation is typically performed every 15 minutes, tracing the effects of changes both internally and externally in an automated and truly live analysis. The Beacon deployment will then immediately identify the control choice leading to the lowest cost and adjust the HVAC system accordingly.
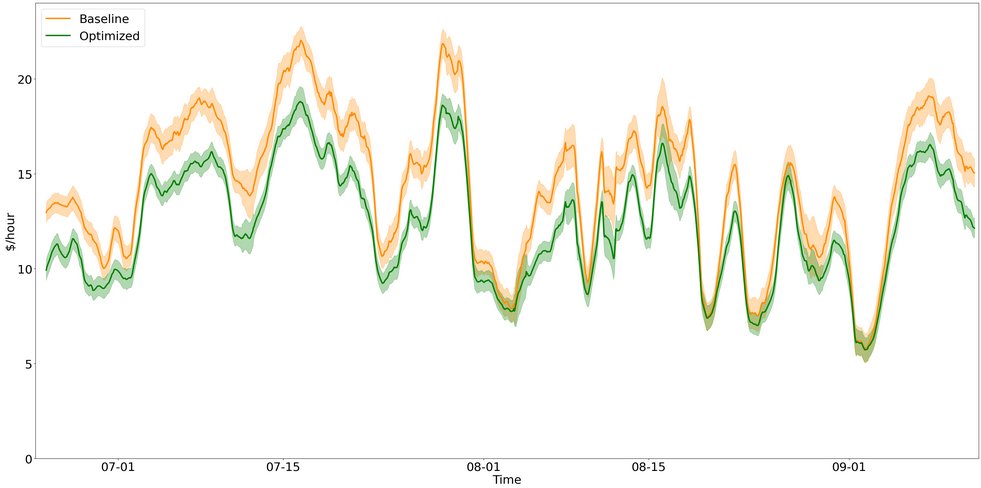
An M&V comparison between control scenarios is now as easy as visualizing this detailed cost comparison between the different choices, typically reduced to one for the baseline scenario (however complex) and the optimized Beacon output (see Figure 1 below). How good, and how convincing, this M&V approach is comes down to the accuracy of the machine learning model for predicting the output, in particular the cost of consumables. We continuously monitor a number of metrics to assess this and base deployment decisions on strict criteria. An important benchmark for acceptable performance are the values established by ASHRAE for model-based optimization, guideline 14-2014, requiring the Coefficient of Variation - Root Mean Square Error (CV(RMSE)) to be below 30% and Normalized Mean Bias Error (NMBE) below 10%, when hourly data are used. All our deployed models significantly outperform these thresholds by achieving CV(RMSE) <10% and NMBE <5% for an even finer 15-minute binning of data.
Basing M&V on accurate modeling of the performance of the system at any time eliminates the need for actually switching between different scenarios, which means that the decision to continue or prematurely stop an optimization attempt can also be handled far more flexibly. Another important benefit is that the analysis on sub-hour timescales can also include complex utility cost structures. In particular, peak demand pricing, that not only depends on accumulated kilowatt-hours but also on the value of instantaneous kW peaks in power and the time of day at which they occur, can be directly integrated in both the M&V calculation and the optimization. This guarantees live tracking of the true cost of operating decisions.
In conclusion, using Beacon AI to optimize HVAC systems not only makes the best use of all available data, but frees M&V considerations from lengthy and complex procedures for assessing the benefits of changes in operation. The machine learning models at the heart of Tagup’s technology already make inherent use of a very detailed, accurate, and fully time-resolved picture of how the whole HVAC system performs under any given scenario and condition. So, not only do we speak M&V, but so do our models.
----
1. While directly influencing only the cooling towers’ control logic and thus fan speeds, the feedback effects on the efficiency of chillers and any other equipment connected to the condenser loop makes the condenser temperature setpoint a crucial tuning parameter for optimizing the full HVAC system.


